Work

Potential drivers of crises in the Arctic (2021)

A portion of a map that shows Arctic Council states and observer countries.

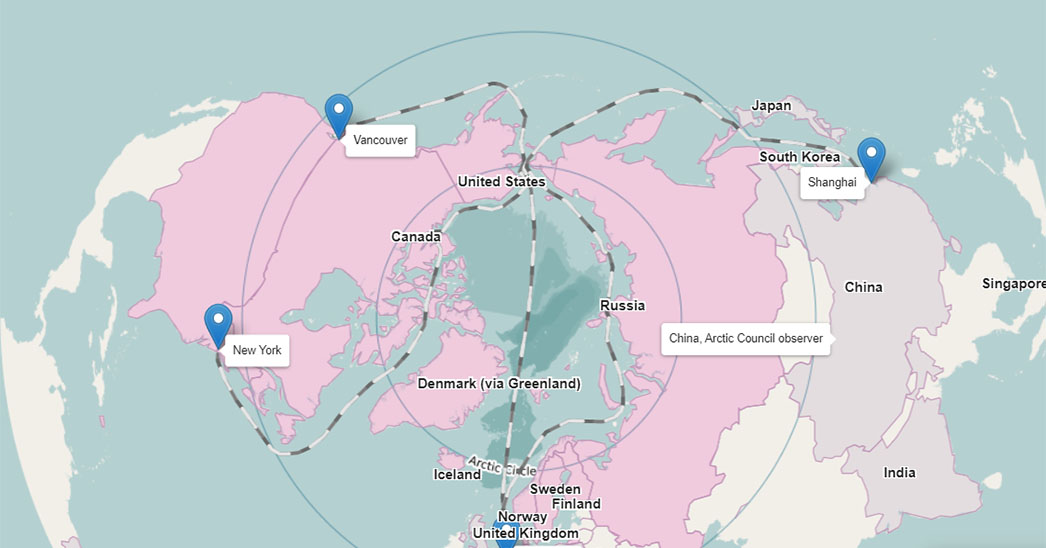
Co-design and co-development of an interactive map.

view

Contributions:
design, development
Tools:
R, Leaflet, CSS, JavaScript, QGIS

Russian weapon marketing and sales (2021)

A portion of a map that shows where Russian weapons are marketed and sold.

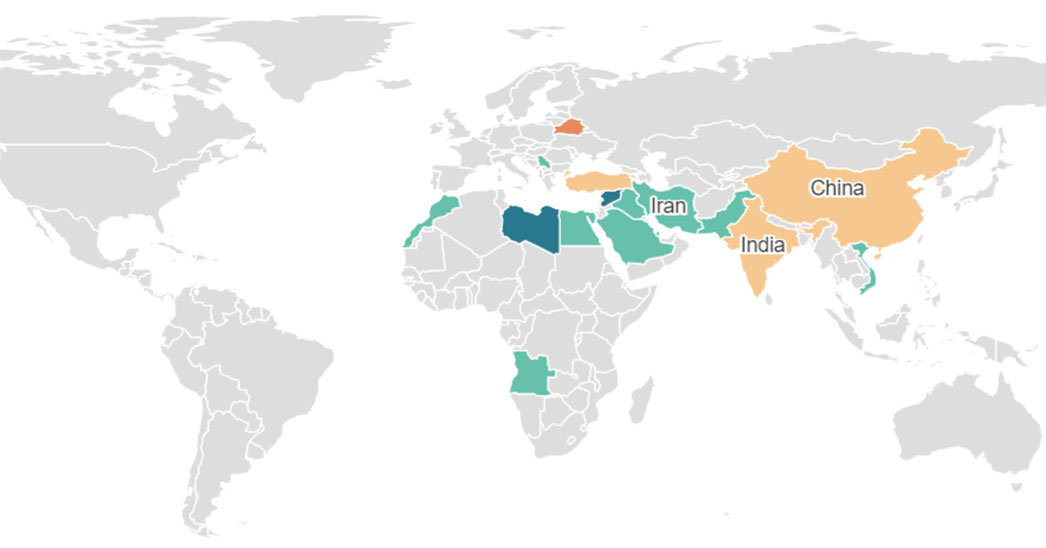
Front end development of an interactive map.

view

Contributions:
design, front end development
Tools:
JavaScript, OpenLayers, HTML, CSS, UXPin

American School District Panel (2021)

A screenshot of the American School District Panel website.

Design for a new website.

view

Contributions:
design
Tools:
UXPin, Illustrator

Internet of bodies (2020)

An illustration of a man surrounded by devices that collect data from people's bodies.

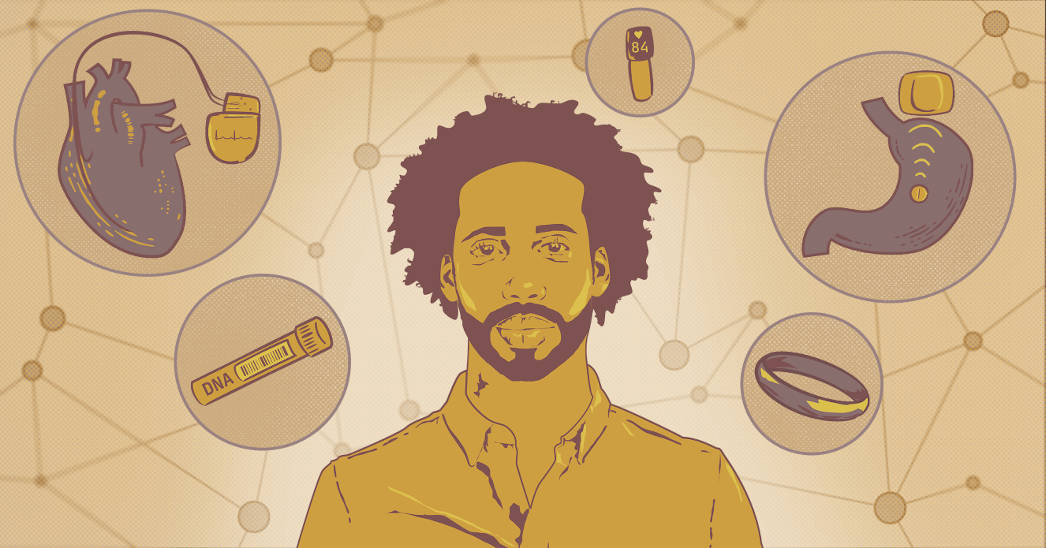
Design, illustration, and development for an article on potential risks and opportunities of devices that connect to our bodies.

view

Contributions:
design, illustration, front end development
Tools:
HTML, CSS, JavaScript, Illustrator, Photoshop, UXPin

Brain-computer interfaces (2020)

An illustration of brains communicating with devices and other brains wirelessly.

Design, illustration, and graphics for an article on the risks and opportunities of brain-computer interfaces.

view

Contributions:
design, illustration, graphics, front end development
Tools:
HTML, CSS, Adobe XD, Krita

The health and economic impacts of COVID-19 interventions (2020)

Two charts that compare fatalities under different scenarios.

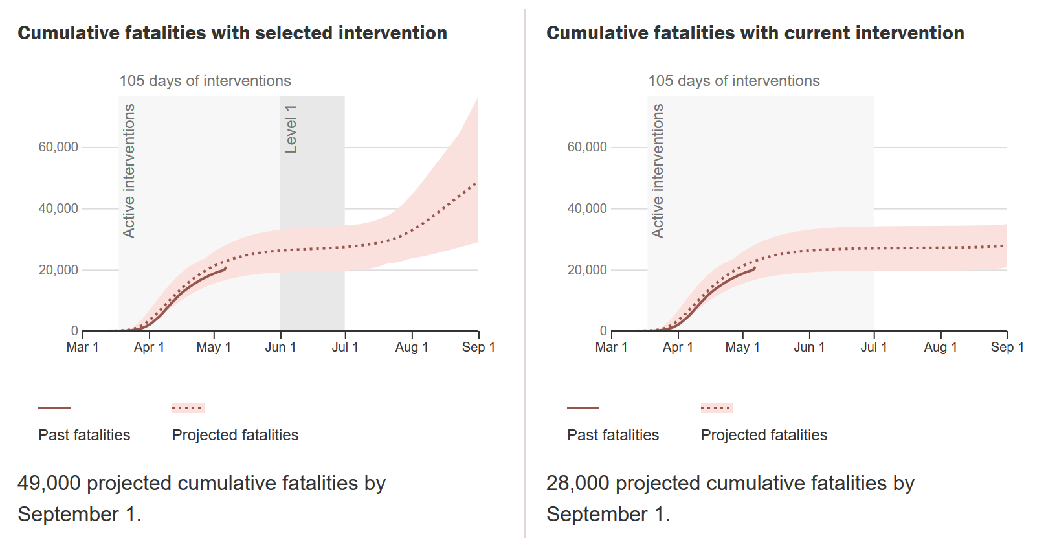
Design and front end development of an interactive tool for exploring the impacts of COVID-19 interventions.

view

Contributions:
design, graphics, front end development
Tools:
JavaScript, Svelte, HTML, CSS, Adobe XD

What Americans think of the news (2020)

A collage of people viewing the news.

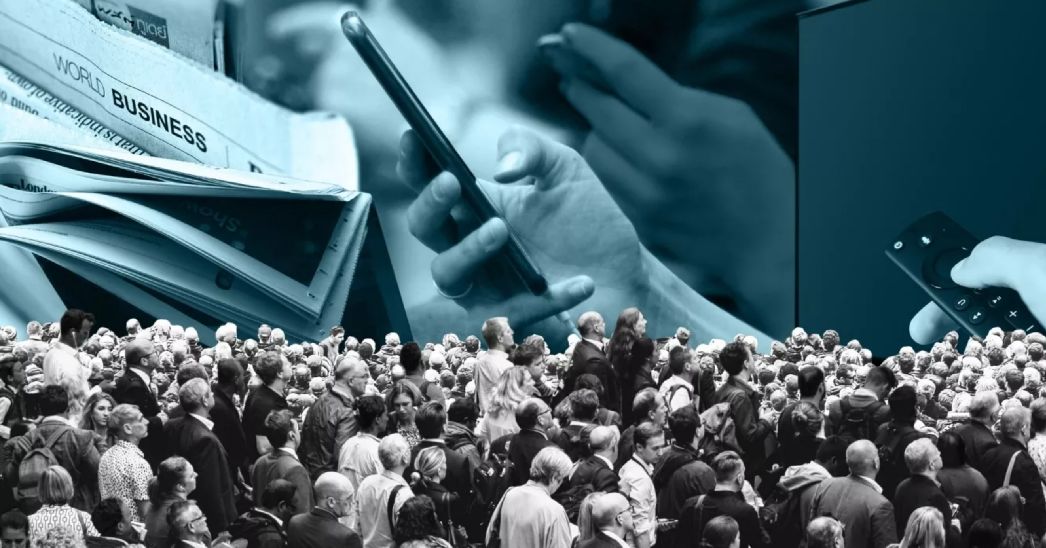
Design and graphics for an article on what Americans think of the news.

view

Contributions:
design, graphics, front end development
Tools:
HTML, CSS, JavaScript, Illustrator, Photoshop

How gun policies affect outcomes (2020)

A diagram that shows where there's evidence, and how much, for how gun policies affect outcomes.

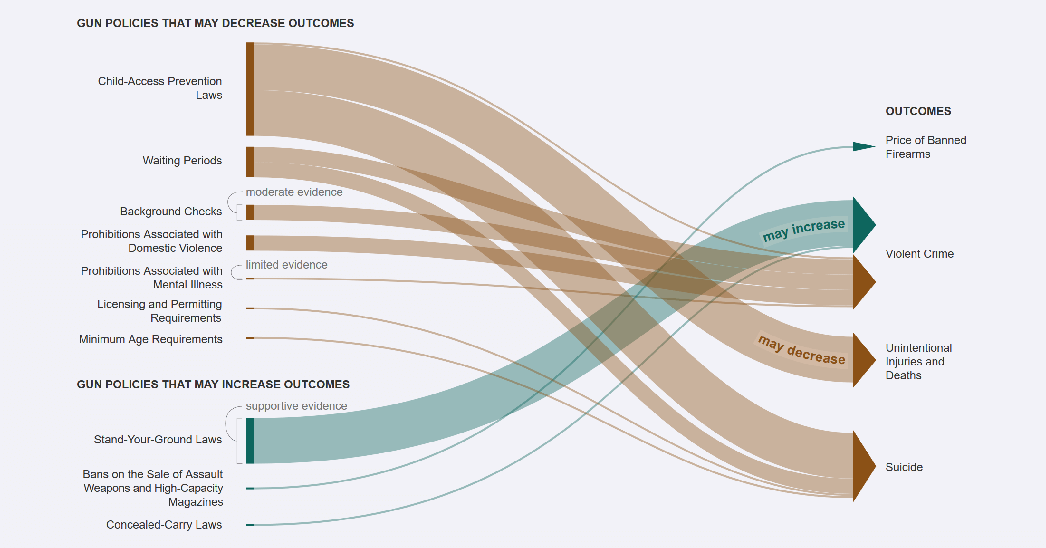
Design and development of an interactive visualization that shows where evidence is strongest for the effects of gun policies.

view

Contributions:
graphics, front end development
Tools:
CSS, JavaScript, Illustrator

Evidence from gun policy research (2020)

A table that summarizes the strength of evidence for how gun policies affect outcomes.

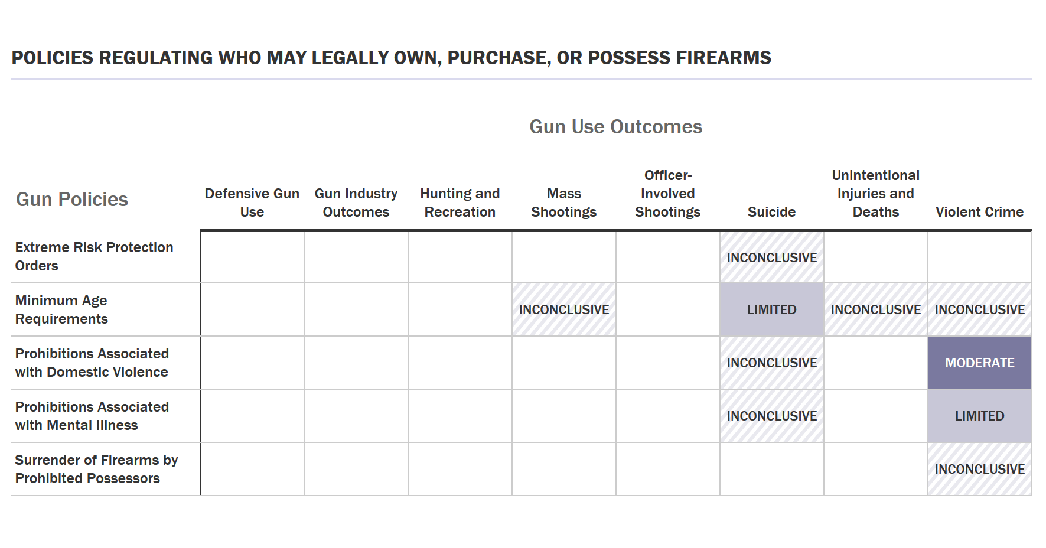
Development of interactive graphics that summarize the strength of evidence for relationships between gun policies and outcomes.

view

Contributions:
graphics, front end development
Tools:
HTML, CSS, JavaScript

Gun policy research (2020)

A visualization that shows the effects of gun policies on violent crime.

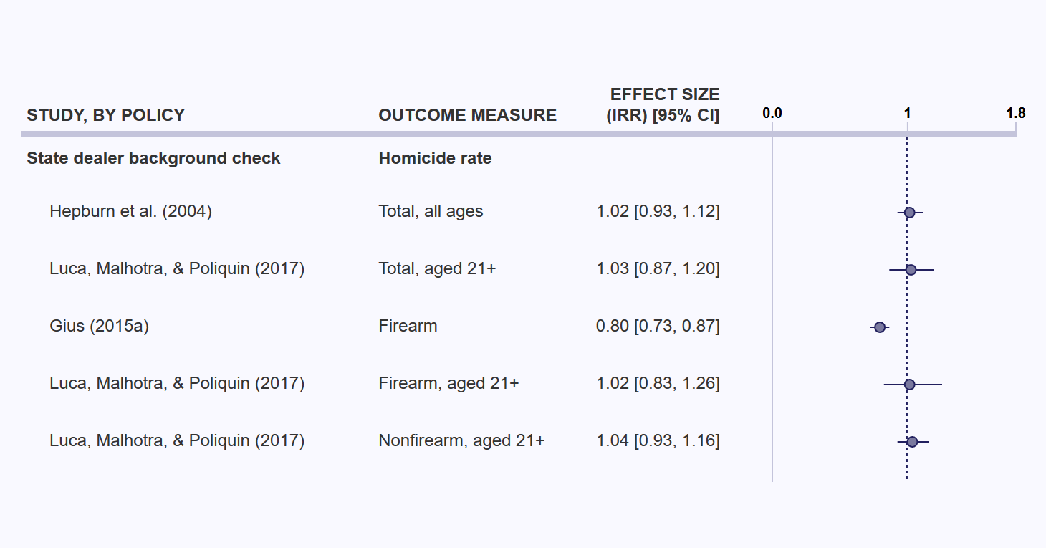
Development of forest plot data visualizations for articles on the research behind how gun policies affect outcomes. Forest plots appear on dozens of pages; just one is linked here.

view

Contributions:
graphics, front end development
Tools:
JavaScript, D3

Quantum computing and encryption (2020)

An illustration of a lock and a key.

Design, illustration, and graphics for an article on how quantum computing may affect encryption.

view

Contributions:
design, illustration, graphics, front end development
Tools:
HTML, CSS, Illustrator, Photoshop

Managing stormwater (2020)

A table that shows whether system factors affect people at the individual, community, or regional level.

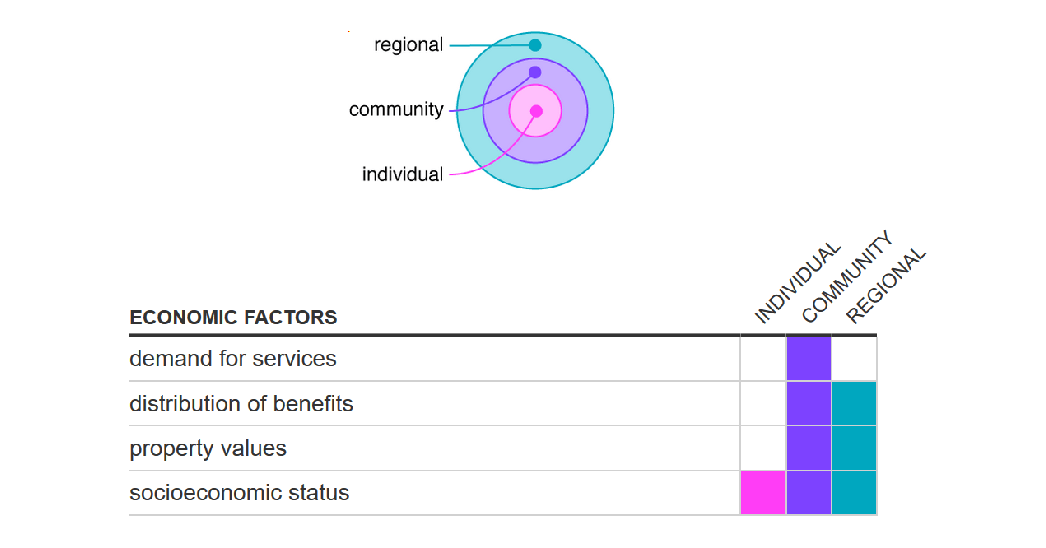
Graphic for an article on green infrastructure.

view

Contributions:
graphics, front end development
Tools:
HTML, CSS, Adobe XD

State firearm law navigator (2019)

A map of the United States that shows where background check laws were in effect in 2019.

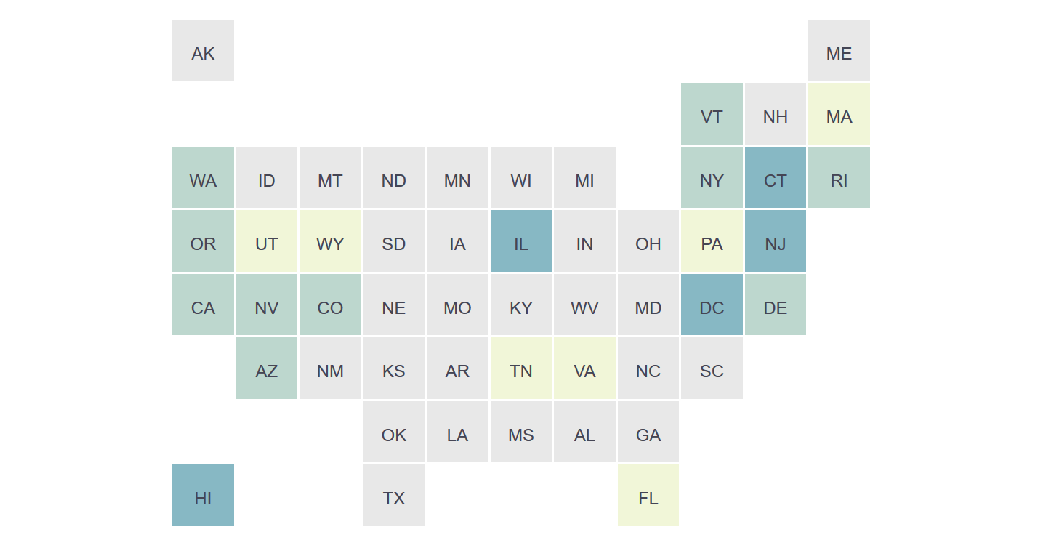
Design and development of an interactive visualization that shows state adoption of firearm laws in the United States over time.

view

Contributions:
design, graphics, front end development
Tools:
JavaScript, D3, HTML, CSS, Adobe XD

The costs of waiting for perfect autonomous vehicles (2017)

A chart that shows the projected effects of allowing autonomous vehicles on roads in different years.

Design and development of an interactive graphic that shows the projected effects of allowing autonomous vehicles on roads in different years.

view

Contributions:
graphics, front end development
Tools:
JavaScript, D3, HTML, CSS